Use a monitoring tool (smartctl, nvme-cli, CrystalDiskInfo, HWiNFO) or a dashboard to poll SSD temps live.
I’ve spent years tuning desktops, servers, and laptops, and I’ll show you exactly how to check SSD temperature in real time, what the numbers mean, and how to act on them. This guide covers Windows, Linux, and macOS tools, command-line examples, dashboard setups, safe ranges, and practical fixes — all from hands-on experience so you can monitor your SSDs reliably and avoid heat-related slowdowns or failures.
Why monitor SSD temperature and when it matters
SSD temperature affects speed, longevity, and reliability. High temps can trigger thermal throttling, slow down sustained writes, and in extreme cases reduce lifespan.
Real-time monitoring helps you spot spikes during backups, video editing, or heavy I/O. Knowing how to check SSD temperature in real time is often the difference between a quick tweak (better airflow) and a costly replacement.

How SSD temperature is reported: SMART vs NVMe
Two common ways SSDs report temperature are S.M.A.R.T. for SATA drives and the NVMe SMART log for NVMe drives. Many SATA SSDs expose a temperature attribute (often attribute 194) reported in Celsius. NVMe drives report a temperature field in the SMART log; most NVMe tools show Kelvin, so convert to Celsius by subtracting 273.15.
When you learn how to check SSD temperature in real time, it helps to know which standard your drive uses so you read values correctly and set proper alert thresholds.

How to check SSD temperature in real time — Windows
On Windows, GUI apps give instant, live readings with minimal setup.
- CrystalDiskInfo: lightweight, shows SMART temp for SATA and many NVMe drives. Set polling interval in settings.
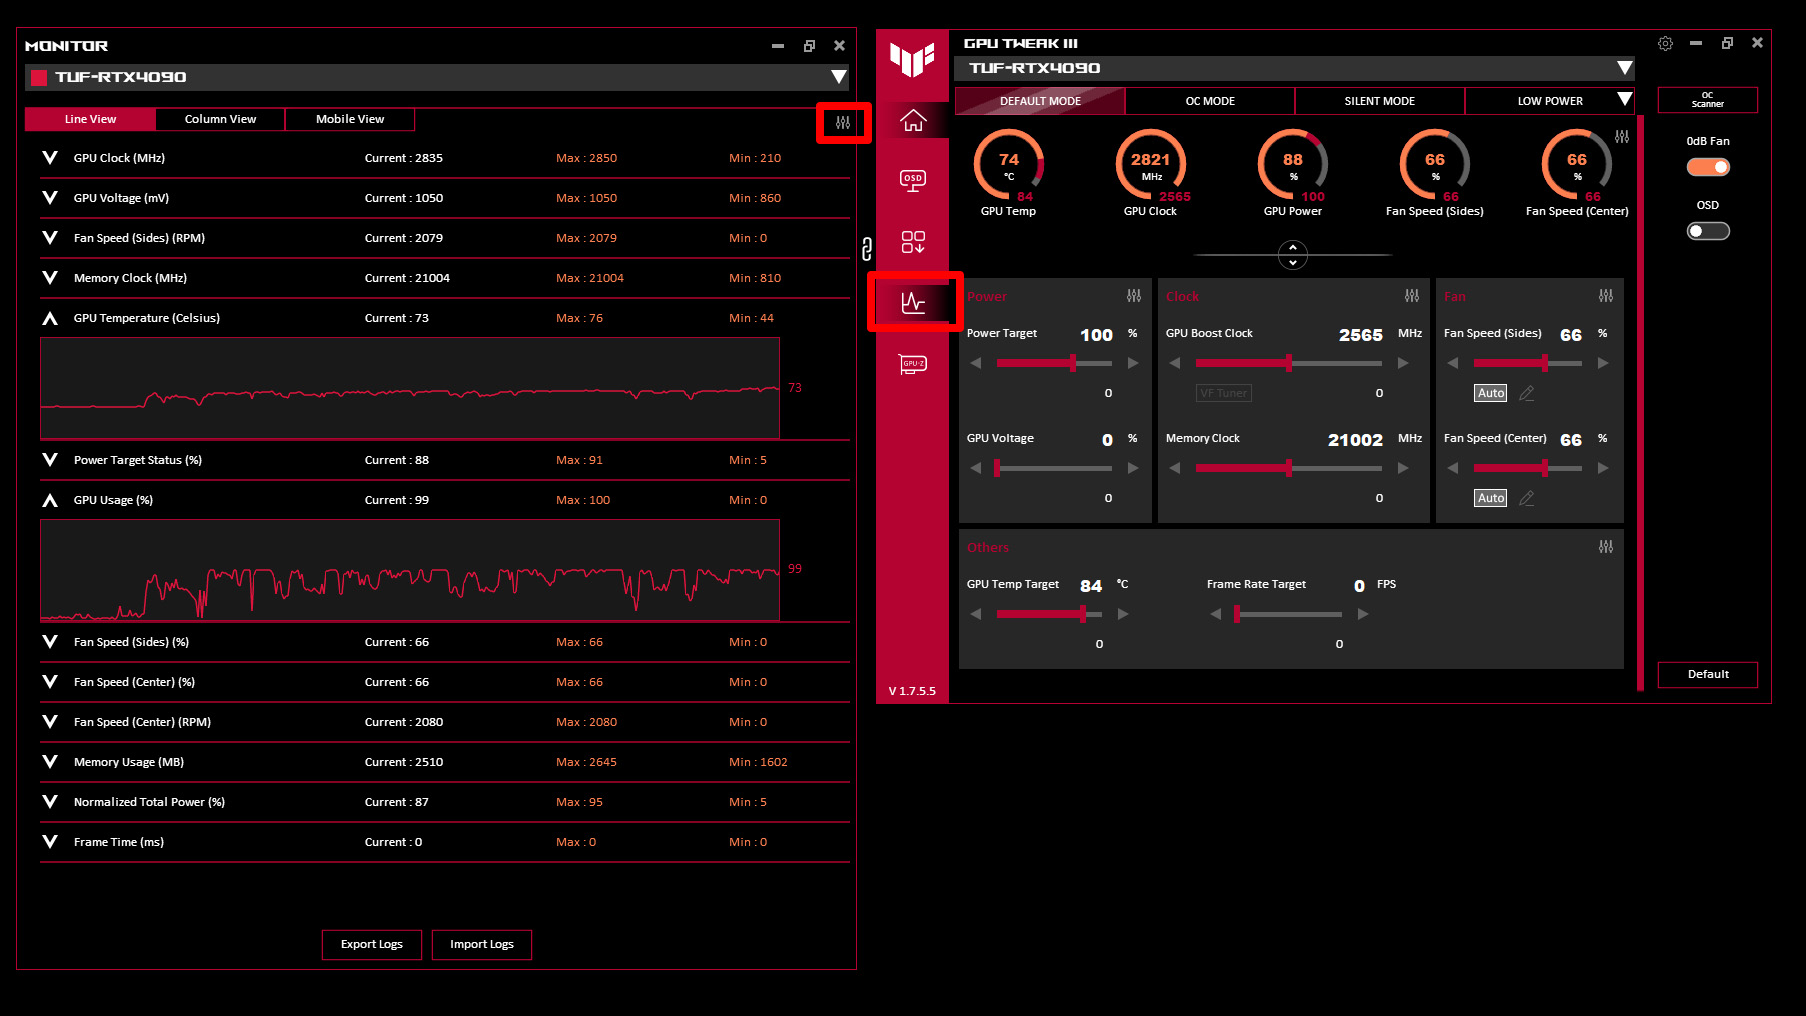
- HWiNFO: detailed real-time sensors, works with most NVMe and SATA SSDs and exposes values to logging tools.
- Manufacturer utilities: Samsung Magician, Intel SSD Toolbox display temps and firmware info for their drives.
Example steps with CrystalDiskInfo:
- Install and launch CrystalDiskInfo.
- Select your SSD from the top-right drive selector.
- Watch the "Temperature" field; enable periodic updates and tray icon if you want always-on monitoring.
These tools make it simple to check SSD temperature in real time without typing commands.

How to check SSD temperature in real time — Linux
Linux gives full control via command line and is ideal for scripting real-time checks.
- smartctl (smartmontools) for SATA and many NVMe: smartctl -A /dev/sda
- nvme-cli for NVMe devices: nvme smart-log /dev/nvme0
- Use watch to poll every second: watch -n 1 'nvme smart-log /dev/nvme0 | grep -i temperature'
Example commands:
watch -n 2 "smartctl -A /dev/sda | grep -i temperature"

# NVMe (nvme-cli)
watch -n 2 "nvme smart-log /dev/nvme0 | grep -i temperature"
Note: NVMe tools commonly show temperature in Kelvin. Convert with: Celsius = Kelvin – 273.15. Once you know how to check SSD temperature in real time on Linux, you can pipe the output into logging or alerting systems.
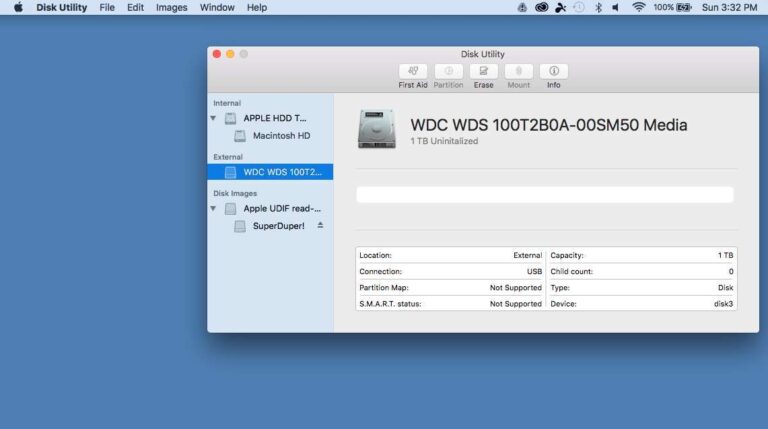
How to check SSD temperature in real time — macOS and lightweight tools
macOS also supports real-time SSD temperature monitoring.
- DriveDx: GUI SMART utility with temperature readouts and alerts.
- iStat Menus: adds a menu bar sensor for disk temps if supported.
- Homebrew + smartmontools: brew install smartmontools then use smartctl like on Linux.
To check SSD temperature in real time on macOS with smartctl:
- Install smartmontools via Homebrew.
- Run: watch -n 2 "smartctl -A /dev/disk0 | grep -i temperature".
These options work well for laptops where you want quick visibility.

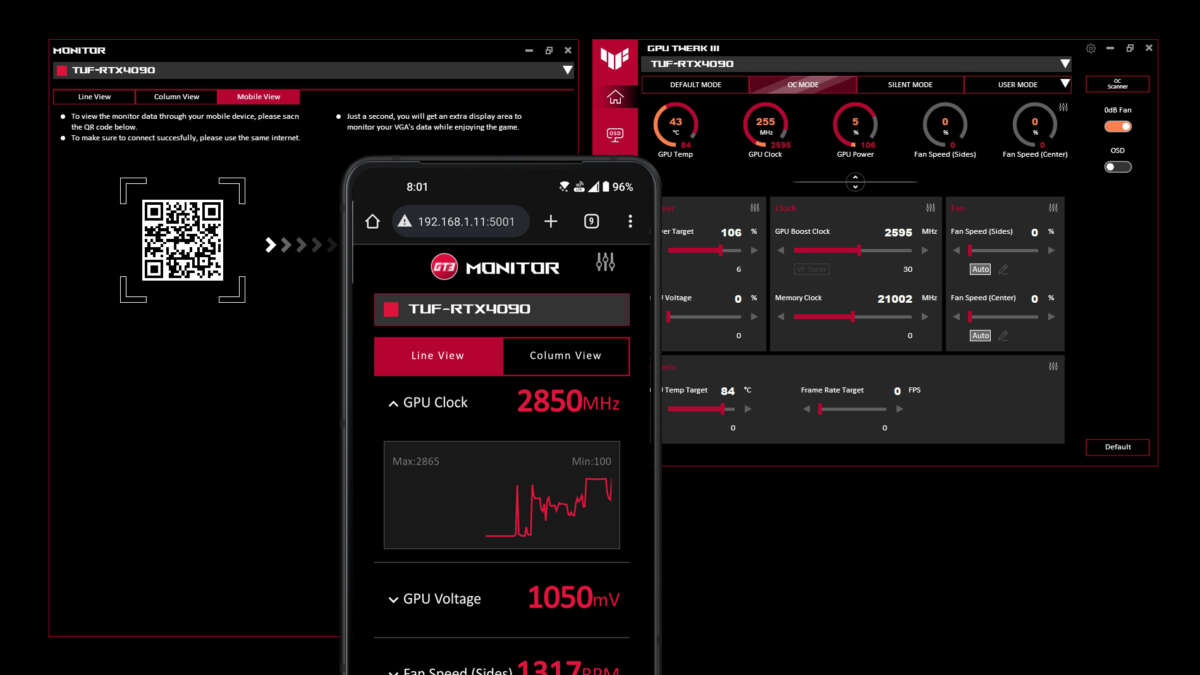
Real-time monitoring for servers and dashboards
For systems that require continuous observation, integrate SSD temp checks into monitoring pipelines.
- Prometheus + nvme_exporter or node_exporter with smartctl scripts to scrape SSD temps.
- Telegraf can run smartctl and send metrics to InfluxDB; pair with Grafana for dashboards.
- Set alerts for thresholds (for example, warn at 65°C, critical at 75°C; tune by drive spec).
If you want to check SSD temperature in real time across many machines, export the metric and make a simple dashboard. From experience, a Grafana panel with a 1–5 second scrape for critical servers gives good visibility without too much noise.
Interpreting readings and safe temperature ranges
What counts as “hot” varies by drive and vendor, but general guidance helps.
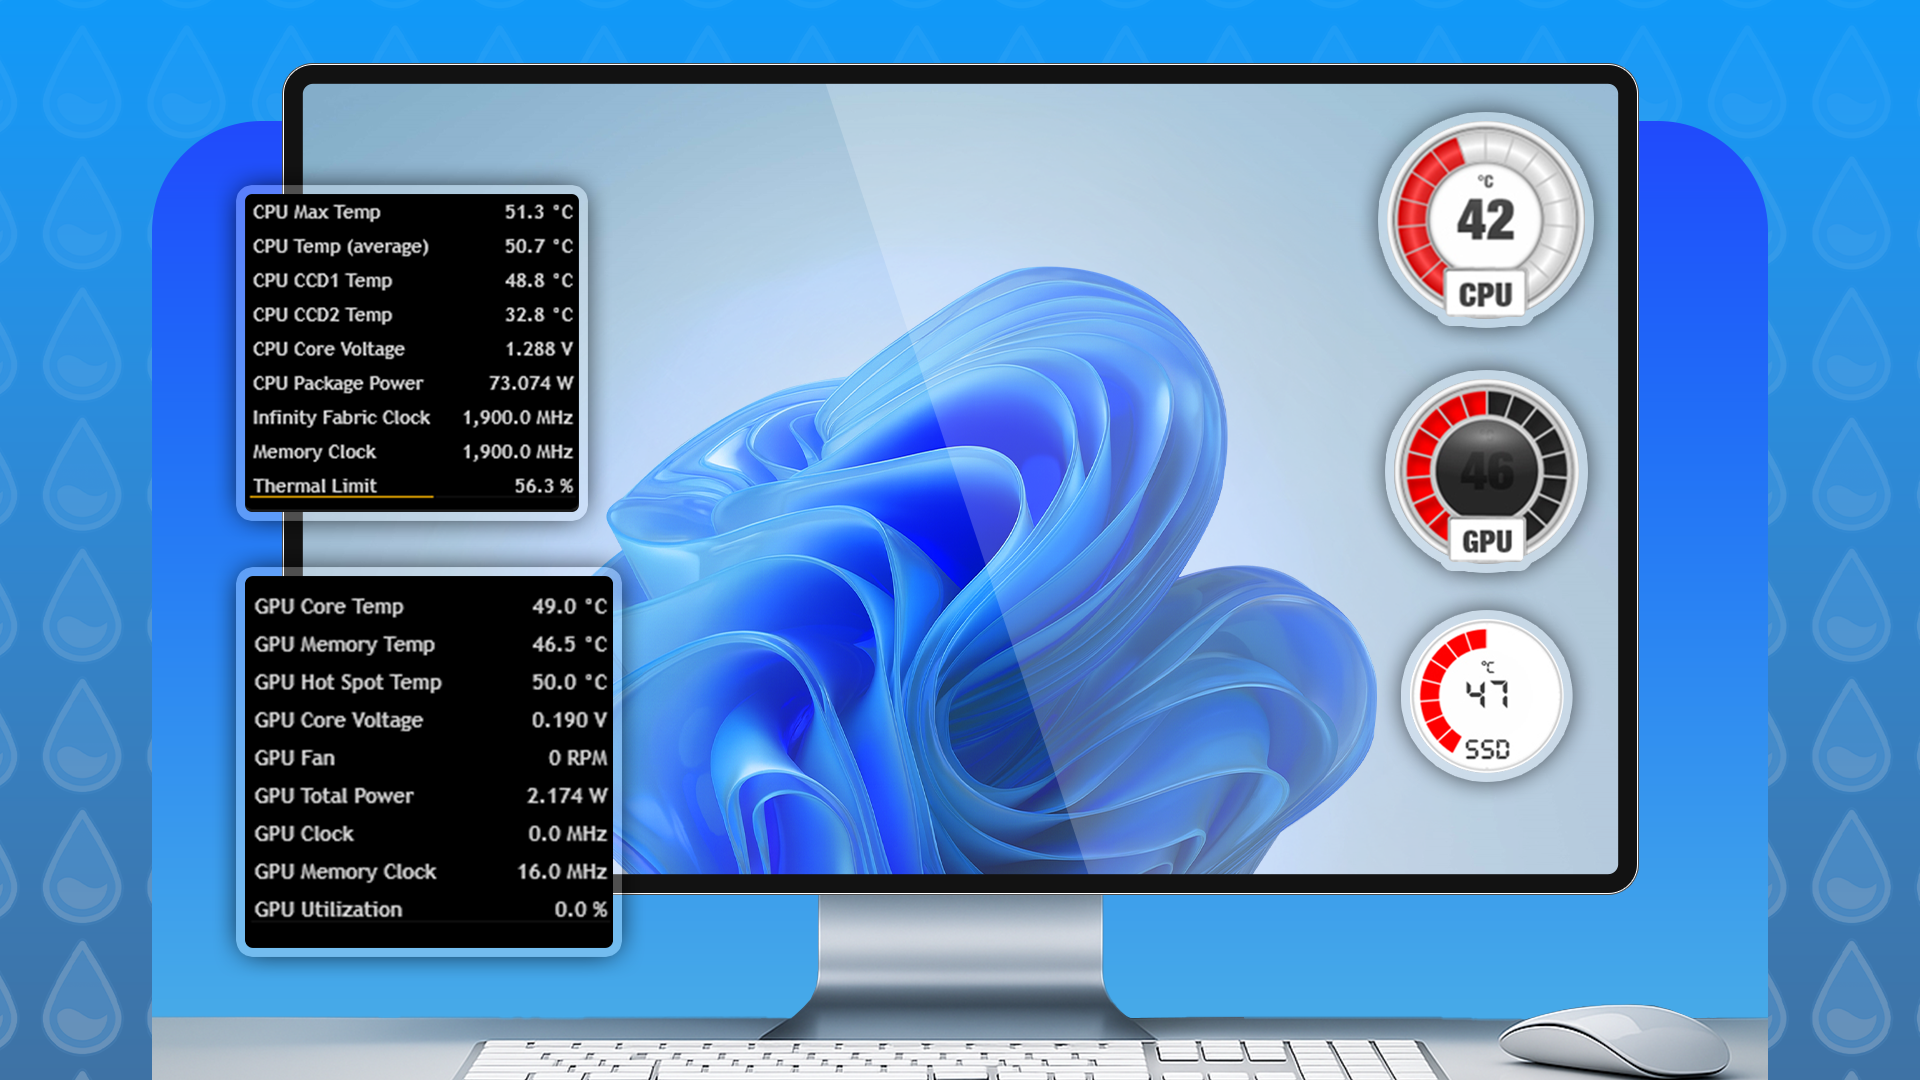
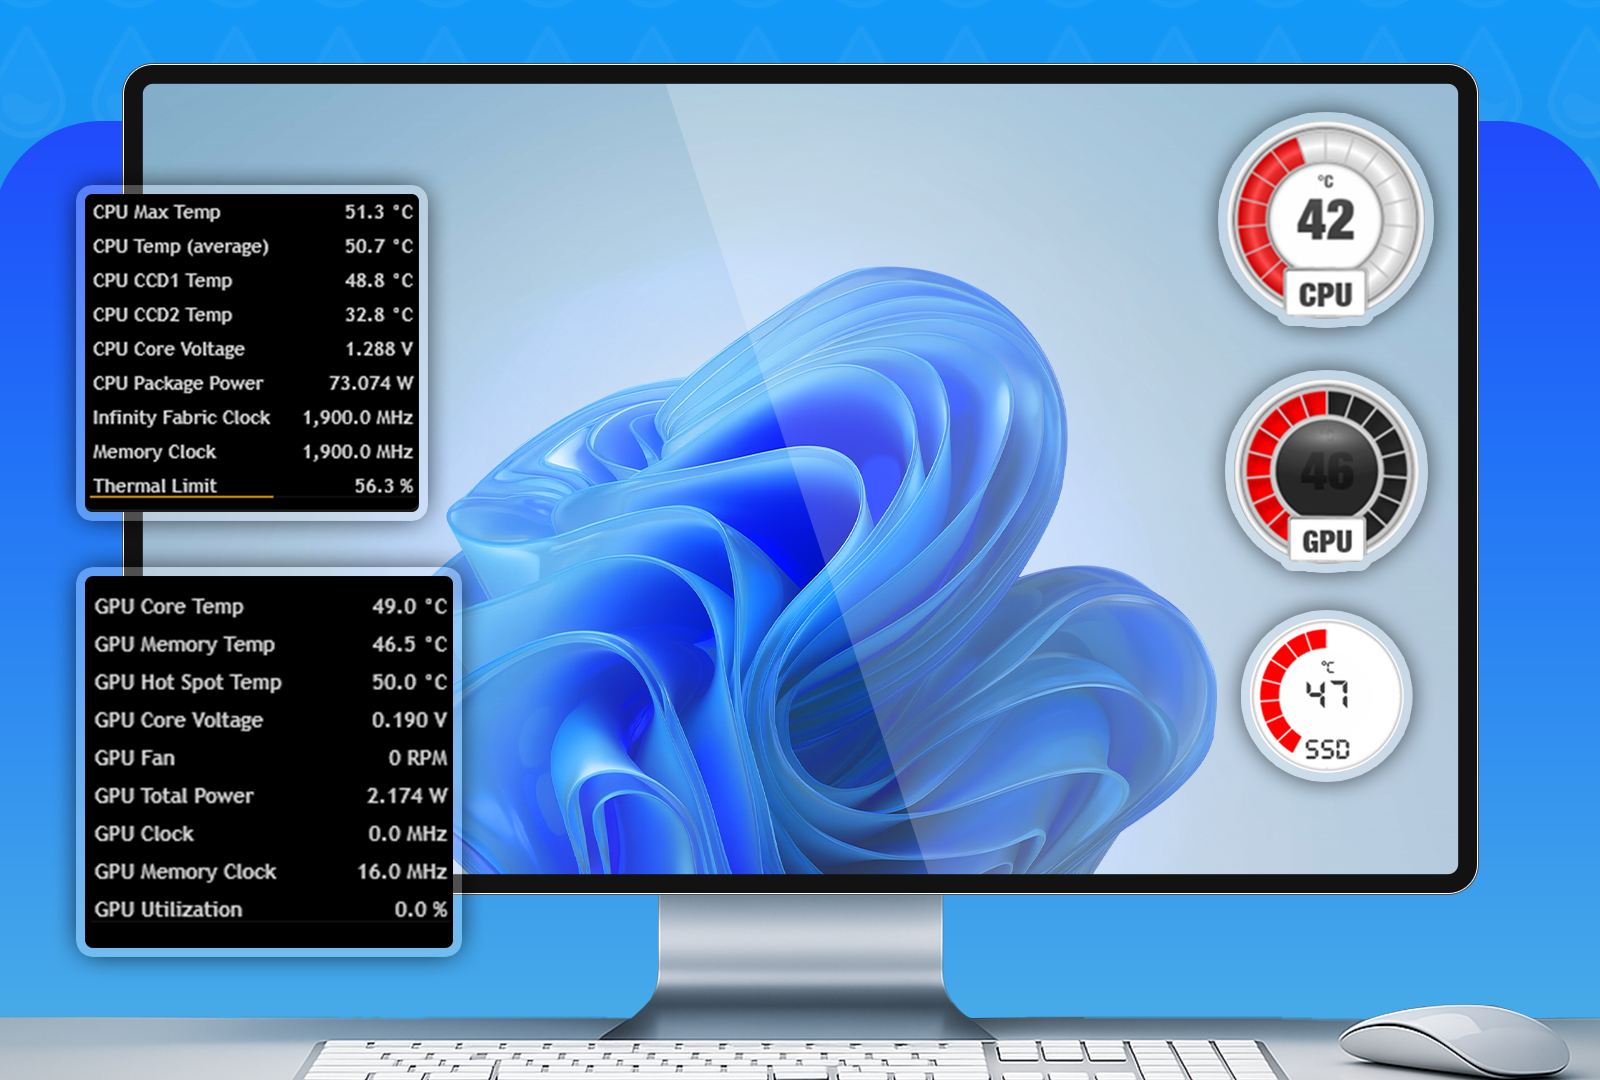
- Idle temp: 30–45°C is typical for modern SSDs in normal environments.
- Under load: 45–70°C is common during heavy writes or sustained I/O.
- Throttling/concern: 70–85°C may trigger thermal throttling or increased wear; check manufacturer specs.
- Critical: 90°C+ is risky and calls for immediate action.
If you learn how to check SSD temperature in real time, always compare readings to the drive’s datasheet. Use conservative alert thresholds and monitor trends over days, not just single spikes.
PAA-style quick questions
- How hot should an SSD run? Most SSDs run safely between 30°C and 70°C; check your drive spec for exact limits.
- Will high SSD temps shorten lifespan? Prolonged high temperatures can accelerate wear and reduce drive life.
- Does NVMe run hotter than SATA? NVMe drives often run hotter due to higher performance and density, so monitor them more closely.

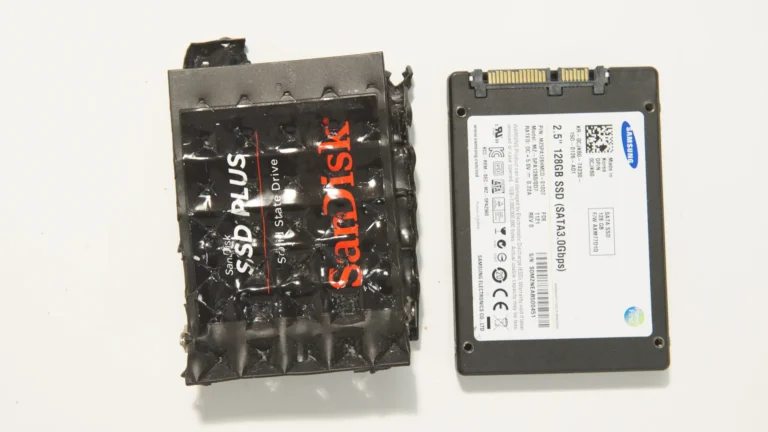
How to reduce SSD temperature and prevent throttling
If temps are too high, try these practical fixes I’ve used:
- Improve airflow: direct case fans to the drive area or use higher flow fans.
- Add a heatsink: many NVMe drives benefit from a small passive heatsink or metal bracket.
- Reposition drives: move a saturated drive away from GPU/CPU hot spots.
- Limit sustained writes: schedule heavy tasks at cooler times or throttle write-heavy jobs.
- Firmware updates: update SSD firmware to pick up thermal management fixes.
Small changes like a heatsink or an extra intake fan often drop temperatures by 5–15°C in my setups.

Mistakes to avoid and troubleshooting tips
Avoid these common traps when you check SSD temperature in real time.
- Relying on a single tool: cross-check with smartctl, nvme-cli, or the manufacturer app if a reading looks off.
- Ignoring units: NVMe Kelvin vs SATA Celsius confusion is real; convert when needed.
- Polling too fast: very frequent polling can flood logs and produce noise; 1–5 second intervals for dashboards, 10–60 seconds for general monitoring.
- Overreacting to short spikes: check trends before replacing hardware.
If readings suddenly jump, verify with another tool, check background jobs, and inspect airflow before concluding there’s a hardware fault.
Personal experience: what worked for me
I monitor a mixed lab of SATA and NVMe drives. My usual workflow when I need to check SSD temperature in real time:
- Use HWiNFO on Windows desktops for quick checks, and nvme-cli + Prometheus for servers.
- Set alerts at 70°C for warning and 78°C for critical; this avoided two cases of thermal throttling during backups.
- I once misread an NVMe log because it returned Kelvin; a quick conversion saved me hours troubleshooting a non-issue.
Lessons learned: validate tools, set sane alert thresholds, and focus on trends not single measurements.
Frequently Asked Questions of how to check ssd temperature in real time
How can I check SSD temperature in real time on Windows?
Use CrystalDiskInfo, HWiNFO, or your SSD vendor utility to see live temperature readings and set polling intervals or tray icons.
What command shows NVMe temperature on Linux?
Use nvme-cli: nvme smart-log /dev/nvme0 and convert Kelvin to Celsius by subtracting 273.15 if required.
At what temperature will an SSD throttle?
Many SSDs start throttling around 70–85°C, but the exact point depends on the model and firmware.
Will monitoring SSD temperature wear the drive?
No. Reading SMART logs does not wear the SSD; write cycles are what affect SSD lifespan.
Can ambient temperature affect SSD readings?
Yes. Higher ambient temps raise idle SSD temperatures. Improve case airflow or cooling to lower drive temps quickly.
Conclusion
Monitoring SSD temperature in real time is practical, simple, and often essential for performance and drive health. Use the right tool for your platform, verify units (Kelvin vs Celsius), set reasonable alert thresholds, and act on trends rather than single spikes. Start by picking one real-time tool from this guide, set up a short-term monitor, and tune cooling or workloads based on what you see. Try a live check now, subscribe to alerts, and leave a comment with your setup or questions — I’ll respond with actionable tips.

Everett Ashford is a tech reviewer at mytechgrid.com specializing in SSDs, cameras, TVs, earbuds, headphones, and other consumer electronics. He provides honest, data-driven reviews based on hands-on testing and real-world performance analysis. Everett simplifies complex tech details to help readers make smart, confident buying decisions.